Monitor API Metrics
API7 Enterprise Edition provides the functionality to expose a comprehensive set of metrics to the monitoring system with minimal delay, facilitating ongoing monitoring and diagnostics. The monitoring and alerting framework of API7 Enterprise Edition is built upon Prometheus, a widely used systems monitoring and alerting toolkit. Prometheus gathers and stores multi-dimensional time series data, including metrics annotated with key-value labels. This guide will walk you through enabling the Prometheus plugin to integrate with the monitoring system, allowing you to collect and visualize HTTP metrics.
Prerequisite(s)
- Obtain a User Account with Super Admin or API Provider Role.
- Complete Add Service from API Definition.
Configure Monitoring for All Services
For optimal monitoring and tracking, enabling the prometheus plugin as a global rule is strongly recommended. This ensures that all services and routes are consistently monitored and tracked.
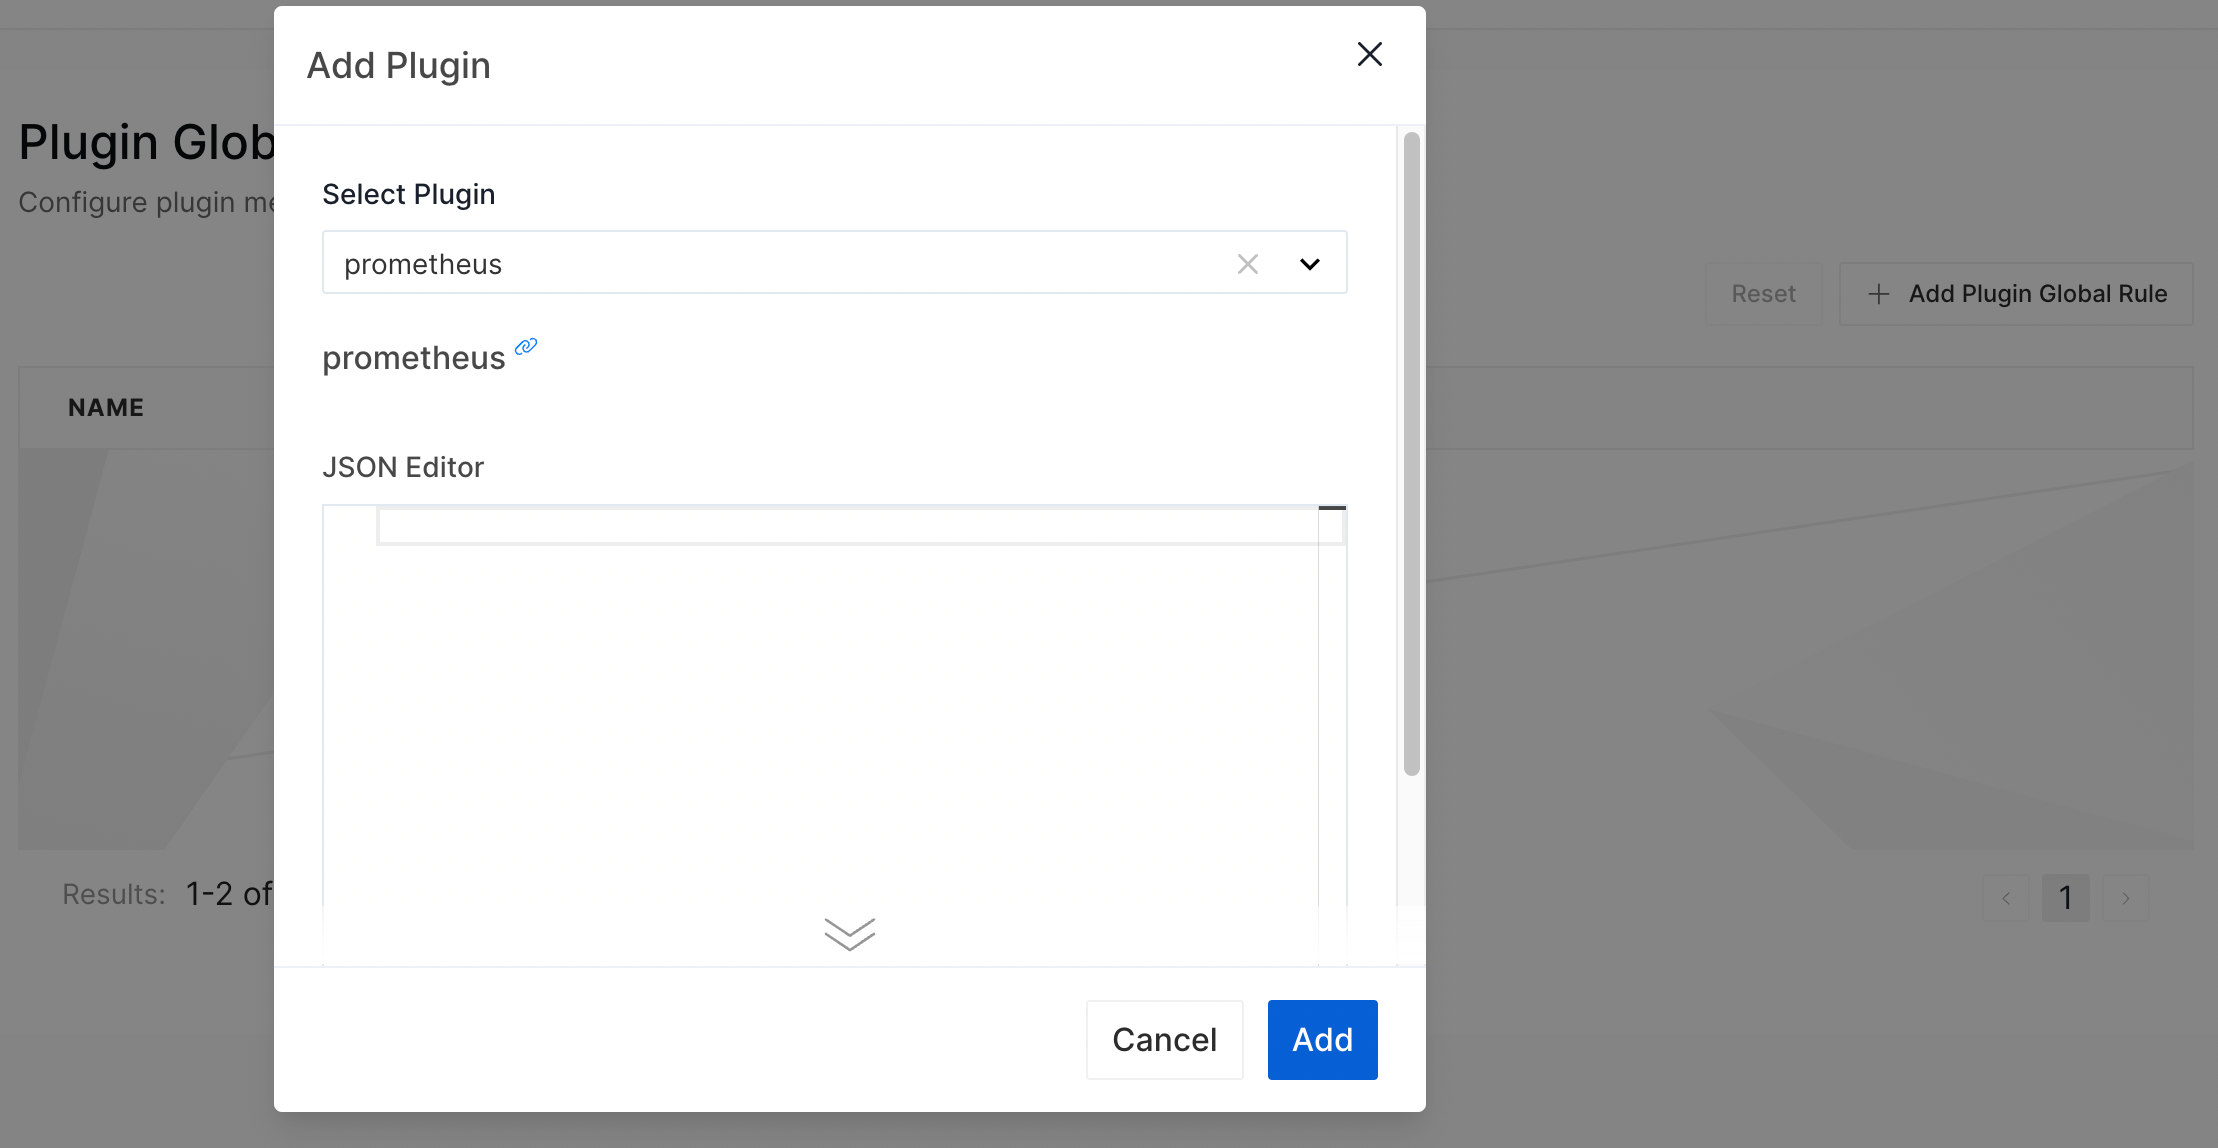
- Select Plugins > Plugin Global Rules, then click Add Plugin Global Rules.
- Choose
Prometheusas the plugin. - Click Add.

- Make API calls.
- Select Monitoring to check the visualized metrics.